Q1 2024 Earnings Calendar

Editor’s note: Any and all references to time frames longer than one trading day are for purposes of market context only, and not recommendations of any holding time frame. Daily rebalancing ETFs are not meant to be held unmonitored for long periods. If you don't have the resources, time or inclination to constantly monitor and manage your positions, leveraged and inverse ETFs are not for you.
First-quarter earnings season is underway! As with last quarter, the backdrop may be rife with challenges. Stubbornly high interest rates continue to pressure consumers and corporations in the U.S., dampening investment enthusiasm, and threatening economic expansion. Simultaneously, inflationary forces continue constricting profit margins for U.S. companies and possibly stunting overall earnings.
According to FactSet, in Q1 2024, the S&P 500 is estimated to experience a 3.2% year-over-year earnings growth, marking the third consecutive quarter of such growth. However, this is lower than the earlier forecast of 5.7%, with downward revisions affecting eight sectors. Despite this, 79 companies within the S&P 500 have provided negative EPS guidance compared to 33 companies with positive guidance. Valuation metrics show that the forward 12-month P/E ratio stands at 20.5, surpassing both the 5-year and 10-year averages. In terms of actual results, as of April 5th, 18 companies have reported a positive EPS surprise out of 20 reporting, while 9 companies have reported a positive revenue surprise.
Overall, the market's expectations for earnings forecasts are a delicate balance between optimism about the ongoing recovery and vigilance regarding the challenges that could potentially hinder corporate performance.
Here’s a list of announcement dates with related Leveraged & Inverse ETFs, week-by-week for 2024’s Q1 earnings season.
Earnings dates are subject to change without notice.
Q1 2024 Earnings Season - % of Each Index Reporting by Week
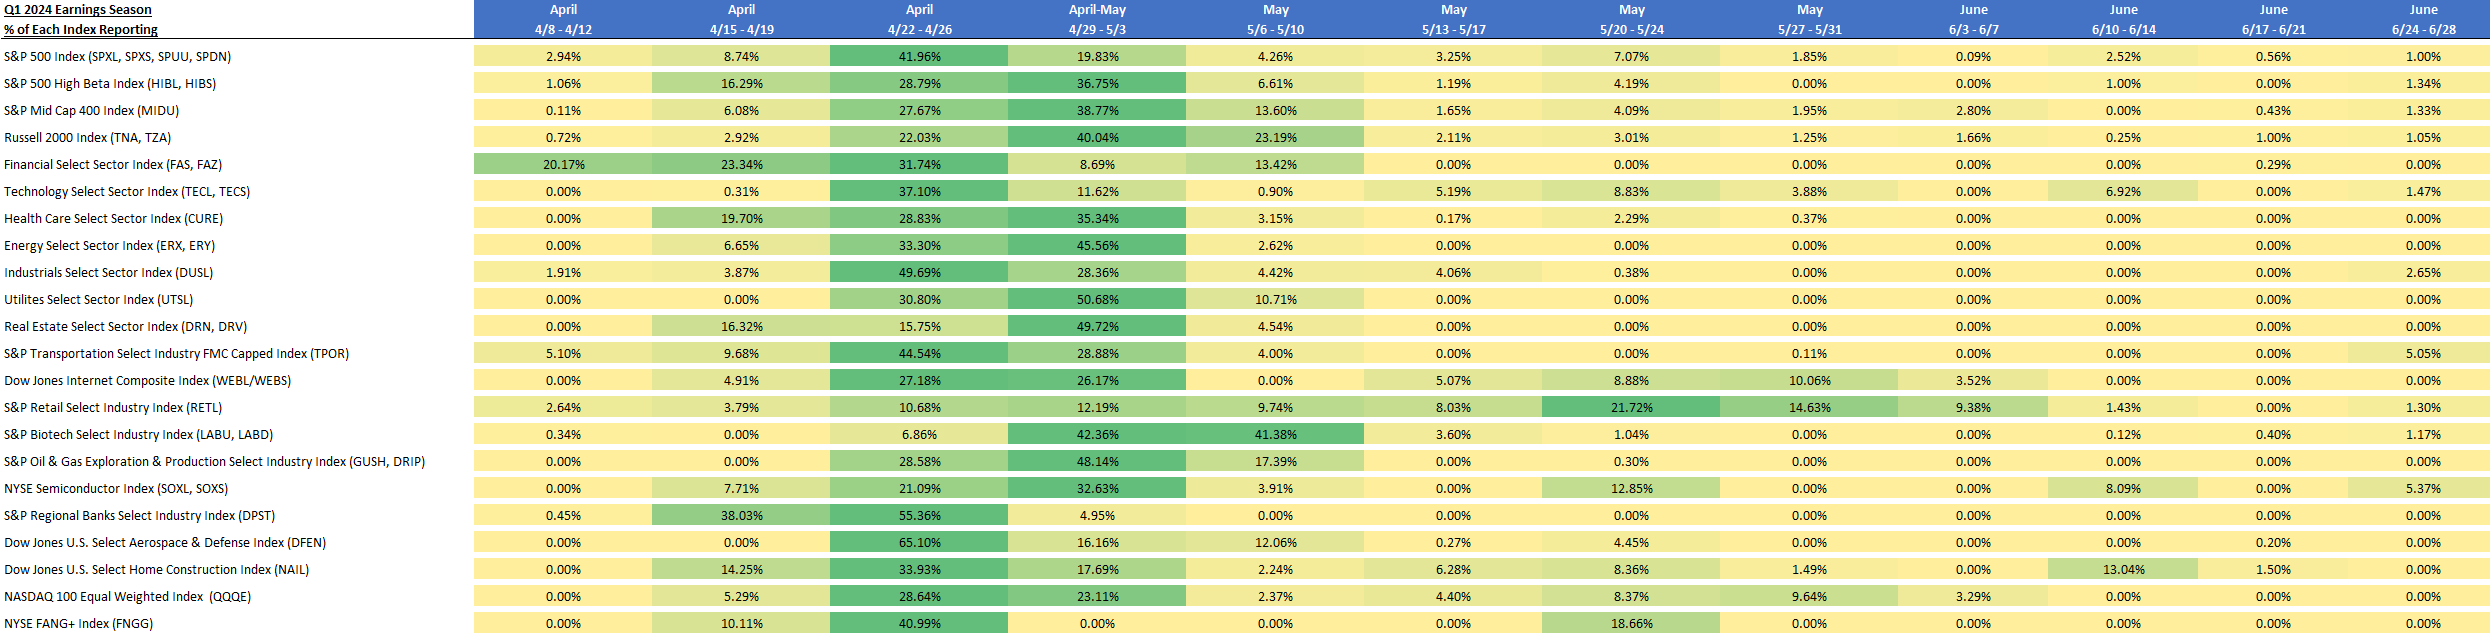
Source: Bloomberg Data Management Services. Figures represent percent of companies in each index expected to release earnings reports by week. Green shading identifies the week with the highest percentages. Index descriptions are provided at the end of the page. One cannot directly invest in an index.
S&P 500 Index
| Ticker | Name | Weight in the Index | Expected Earnings Release |
| MSFT UW | Microsoft Corp | 7.24% | 4/25/2024 |
| NVDA UW | NVIDIA Corp | 4.96% | 5/22/2024 |
| AMZN UW | Amazon.com Inc | 3.90% | 4/25/2024 |
| META UW | Meta Platforms Inc | 2.64% | 4/24/2024 |
| GOOGL UW | Alphabet Inc | 2.09% | 4/25/2024 |
| GOOG UW | Alphabet Inc | 1.76% | 4/25/2024 |
| BRK/B UN | Berkshire Hathaway Inc | 1.74% | 5/6/2024 |
| LLY UN | Eli Lilly & Co | 1.42% | 4/30/2024 |
| AVGO UW | Broadcom Inc | 1.35% | 6/12/2024 |
| JPM UN | JPMorgan Chase & Co | 1.31% | 4/12/2024 |
S&P 500 High Beta Index
| Ticker | Name | Weight in the Index | Expected Earnings Release |
| CMA UN | Comerica Inc | 1.54% | 4/18/2024 |
| NVDA UW | NVIDIA Corp | 1.52% | 5/22/2024 |
| GNRC UN | Generac Holdings Inc | 1.41% | 5/3/2024 |
| KEY UN | KeyCorp | 1.41% | 4/18/2024 |
| ALGN UW | Align Technology Inc | 1.39% | 4/24/2024 |
| CZR UW | Caesars Entertainment Inc | 1.37% | 4/30/2024 |
| CCL UN | Carnival Corp | 1.34% | 6/26/2024 |
| MPWR UW | Monolithic Power Systems Inc | 1.33% | 5/3/2024 |
| NCLH UN | Norwegian Cruise Line Holdings Ltd | 1.33% | 5/1/2024 |
| ENPH UQ | Enphase Energy Inc | 1.28% | 4/25/2024 |
Financials Select Sector Index
| Ticker | Name | Weight in the Index | Expected Earnings Release |
| BRK/B UN | Berkshire Hathaway Inc | 13.26% | 5/6/2024 |
| JPM UN | JPMorgan Chase & Co | 9.99% | 4/12/2024 |
| V UN | Visa Inc | 7.65% | 4/23/2024 |
| MA UN | Mastercard Inc | 6.86% | 4/26/2024 |
| BAC UN | Bank of America Corp | 4.49% | 4/16/2024 |
| WFC UN | Wells Fargo & Co | 3.61% | 4/12/2024 |
| SPGI UN | S&P Global Inc | 2.43% | 4/25/2024 |
| GS UN | Goldman Sachs Group Inc/The | 2.33% | 4/15/2024 |
| AXP UN | American Express Co | 2.24% | 4/19/2024 |
| PGR UN | Progressive Corp/The | 2.14% | 4/12/2024 |
Health Care Select Sector Index
| Ticker | Name | Weight in the Index | Expected Earnings Release |
| LLY UN | Eli Lilly & Co | 11.72% | 4/30/2024 |
| UNH UN | UnitedHealth Group Inc | 7.96% | 4/16/2024 |
| JNJ UN | Johnson & Johnson | 6.92% | 4/16/2024 |
| MRK UN | Merck & Co Inc | 6.07% | 4/25/2024 |
| TMO UN | Thermo Fisher Scientific Inc | 4.23% | 4/24/2024 |
| DHR UN | Danaher Corp | 3.04% | 4/23/2024 |
| PFE UN | Pfizer Inc | 2.85% | 5/1/2024 |
| AMGN UW | Amgen Inc | 2.72% | 5/2/2024 |
| ISRG UW | Intuitive Surgical Inc | 2.57% | 4/18/2024 |
| ELV UN | Elevance Health Inc | 2.25% | 4/18/2024 |
Industrials Select Sector Index
| Ticker | Name | Weight in the Index | Expected Earnings Release |
| CAT UN | Caterpillar Inc | 4.99% | 4/26/2024 |
| GE UN | General Electric Co | 4.39% | 4/23/2024 |
| UBER UN | Uber Technologies Inc | 3.98% | 5/2/2024 |
| UNP UN | Union Pacific Corp | 3.83% | 4/25/2024 |
| RTX UN | RTX Corp | 3.50% | 4/23/2024 |
| HON UW | Honeywell International Inc | 3.38% | 4/25/2024 |
| ETN UN | Eaton Corp PLC | 3.37% | 5/2/2024 |
| UPS UN | United Parcel Service Inc | 2.83% | 4/23/2024 |
| DE UN | Deere & Co | 2.78% | 5/16/2024 |
| BA UN | Boeing Co/The | 2.72% | 4/24/2024 |
Real Estate Select Sector Index
| Ticker | Name | Weight in the Index | Expected Earnings Release |
| PLD UN | Prologis Inc | 11.86% | 4/17/2024 |
| EQIX UW | Equinix Inc | 7.56% | 5/3/2024 |
| WELL UN | Welltower Inc | 5.19% | 5/2/2024 |
| SPG UN | Simon Property Group Inc | 4.98% | 5/2/2024 |
| PSA UN | Public Storage | 4.60% | 4/30/2024 |
| O UN | Realty Income Corp | 4.54% | 5/6/2024 |
| CCI UN | Crown Castle Inc | 4.46% | 4/17/2024 |
| DLR UN | Digital Realty Trust Inc | 4.43% | 5/2/2024 |
| CSGP UW | CoStar Group Inc | 3.93% | 4/23/2024 |
| EXR UN | Extra Space Storage Inc | 3.19% | 4/30/2024 |
Dow Jones Internet Composite Index
| Ticker | Name | Weight in the Index | Expected Earnings Release |
| META UW | Meta Platforms Inc | 7.52% | 4/24/2024 |
| GOOGL UW | Alphabet Inc | 5.16% | 4/25/2024 |
| CRM UN | Salesforce Inc | 5.11% | 5/31/2024 |
| CSCO UW | Cisco Systems Inc | 5.07% | 5/15/2024 |
| NFLX UW | Netflix Inc | 4.91% | 4/18/2024 |
| GOOG UW | Alphabet Inc | 4.46% | 4/25/2024 |
| PYPL UW | PayPal Holdings Inc | 3.61% | 4/30/2024 |
| SNOW UN | Snowflake Inc | 3.00% | 5/24/2024 |
| WDAY UW | Workday Inc | 2.93% | 5/24/2024 |
| ANET UN | Arista Networks Inc | 2.56% | 5/1/2024 |
S&P Biotechnology Select Industry Index
| Ticker | Name | Weight in the Index | Expected Earnings Release |
| EXAS UR | Exact Sciences Corp | 1.27% | 5/8/2024 |
| CYTK UW | Cytokinetics Inc | 1.20% | 5/3/2024 |
| CRNX UW | Crinetics Pharmaceuticals Inc | 1.18% | 5/3/2024 |
| ROIV UW | Roivant Sciences Ltd | 1.17% | 6/28/2024 |
| NTRA UW | Natera Inc | 1.15% | 5/9/2024 |
| ARQT UW | Arcutis Biotherapeutics Inc | 1.15% | 5/9/2024 |
| EXEL UW | Exelixis Inc | 1.12% | 5/9/2024 |
| VKTX UR | Viking Therapeutics Inc | 1.12% | 4/26/2024 |
| KRYS UW | Krystal Biotech Inc | 1.12% | 5/8/2024 |
| ALNY UW | Alnylam Pharmaceuticals Inc | 1.11% | 5/3/2024 |
NYSE Semiconductor Index
| Ticker | Name | Weight in the Index | Expected Earnings Release |
| NVDA UW | NVIDIA Corp | 8.91% | 5/22/2024 |
| AVGO UW | Broadcom Inc | 8.09% | 6/12/2024 |
| AMD UW | Advanced Micro Devices Inc | 6.92% | 5/2/2024 |
| QCOM UW | QUALCOMM Inc | 6.64% | 5/1/2024 |
| INTC UW | Intel Corp | 5.38% | 4/25/2024 |
| MU UW | Micron Technology Inc | 5.37% | 6/28/2024 |
| MCHP UW | Microchip Technology Inc | 4.17% | 5/3/2024 |
| LRCX UW | Lam Research Corp | 4.01% | 4/24/2024 |
| TSM UN | Taiwan Semiconductor Manufacturing Co Ltd | 4.00% | 4/18/2024 |
| MRVL UW | Marvell Technology Inc | 3.94% | 5/24/2024 |
Dow Jones U.S. Select Home Construction Index
| Ticker | Name | Weight in the Index | Expected Earnings Release |
| DHI UN | DR Horton Inc | 14.25% | 4/18/2024 |
| LEN UN | Lennar Corp | 12.46% | 6/14/2024 |
| NVR UN | NVR Inc | 7.69% | 4/25/2024 |
| PHM UN | PulteGroup Inc | 7.50% | 4/23/2024 |
| LOW UN | Lowe's Cos Inc | 4.40% | 5/23/2024 |
| SHW UN | Sherwin-Williams Co/The | 4.35% | 4/25/2024 |
| BLD UN | TopBuild Corp | 4.26% | 5/3/2024 |
| HD UN | Home Depot Inc/The | 4.21% | 5/14/2024 |
| TOL UN | Toll Brothers Inc | 3.96% | 5/23/2024 |
| BLDR UN | Builders FirstSource Inc | 3.18% | 5/3/2024 |
NASDAQ 100 Equal Weighted Index
| Ticker | Name | Weight in the Index | Expected Earnings Release |
| META UW | Meta Platforms Inc | 8.63% | 4/24/2024 |
| GOOGL UW | Alphabet Inc | 5.86% | 4/25/2024 |
| NFLX UW | Netflix Inc | 5.29% | 4/18/2024 |
| CRM UN | Salesforce Inc | 5.28% | 5/31/2024 |
| GOOG UW | Alphabet Inc | 4.95% | 4/25/2024 |
| CSCO UW | Cisco Systems Inc | 4.40% | 5/15/2024 |
| PYPL UW | PayPal Holdings Inc | 3.31% | 4/30/2024 |
| ANET UN | Arista Networks Inc | 3.23% | 5/1/2024 |
| WDAY UW | Workday Inc | 2.76% | 5/24/2024 |
| SNOW UN | Snowflake Inc | 2.52% | 5/24/2024 |
S&P Mid Cap 400® Index
| Ticker | Name | Weight in the Index | Expected Earnings Release |
| VST UN | Vistra Corp | 0.91% | 5/9/2024 |
| WSM UN | Williams-Sonoma Inc | 0.74% | 5/23/2024 |
| RS UN | Reliance Inc | 0.73% | 4/25/2024 |
| CSL UN | Carlisle Cos Inc | 0.72% | 4/26/2024 |
| GDDY UN | GoDaddy Inc | 0.66% | 5/3/2024 |
| EME UN | EMCOR Group Inc | 0.64% | 4/26/2024 |
| PSTG UN | Pure Storage Inc | 0.59% | 5/31/2024 |
| SAIA UW | Saia Inc | 0.58% | 4/29/2024 |
| GGG UN | Graco Inc | 0.58% | 4/26/2024 |
| LII UN | Lennox International Inc | 0.57% | 4/24/2024 |
Russell 2000® Index
| Ticker | Name | Weight in the Index | Expected Earnings Release |
| SMCI UW | Super Micro Computer Inc | 1.83% | 5/2/2024 |
| MSTR UW | MicroStrategy Inc | 0.87% | 5/1/2024 |
| FIX UN | Comfort Systems USA Inc | 0.44% | 4/26/2024 |
| ONTO UN | Onto Innovation Inc | 0.36% | 5/3/2024 |
| LNW UW | Light & Wonder Inc | 0.35% | 5/8/2024 |
| ELF UN | elf Beauty Inc | 0.34% | 5/22/2024 |
| WFRD UW | Weatherford International PLC | 0.34% | 4/23/2024 |
| CVNA UN | Carvana Co | 0.33% | 5/1/2024 |
| SSD UN | Simpson Manufacturing Co Inc | 0.32% | 4/24/2024 |
| APG UN | API Group Corp | 0.32% | 5/3/2024 |
Technology Select Sector Index
| Ticker | Name | Weight in the Index | Expected Earnings Release |
| MSFT UW | Microsoft Corp | 23.45% | 4/25/2024 |
| AVGO UW | Broadcom Inc | 4.61% | 6/12/2024 |
| NVDA UW | NVIDIA Corp | 4.41% | 5/22/2024 |
| CRM UN | Salesforce Inc | 3.12% | 5/31/2024 |
| AMD UW | Advanced Micro Devices Inc | 2.94% | 5/2/2024 |
| ORCL UN | Oracle Corp | 2.12% | 6/12/2024 |
| CSCO UW | Cisco Systems Inc | 2.10% | 5/15/2024 |
| QCOM UW | QUALCOMM Inc | 2.07% | 5/1/2024 |
| INTU UW | Intuit Inc | 1.92% | 5/23/2024 |
| AMAT UW | Applied Materials Inc | 1.86% | 5/16/2024 |
Energy Select Sector Index
| Ticker | Name | Weight in the Index | Expected Earnings Release |
| XOM UN | Exxon Mobil Corp | 22.92% | 4/29/2024 |
| CVX UN | Chevron Corp | 16.25% | 4/26/2024 |
| MPC UN | Marathon Petroleum Corp | 4.65% | 4/30/2024 |
| EOG UN | EOG Resources Inc | 4.60% | 5/2/2024 |
| SLB UN | Schlumberger NV | 4.56% | 4/19/2024 |
| PSX UN | Phillips 66 | 4.23% | 4/26/2024 |
| PXD UN | Pioneer Natural Resources Co | 3.69% | 4/26/2024 |
| VLO UN | Valero Energy Corp | 3.60% | 4/25/2024 |
| WMB UN | Williams Cos Inc/The | 2.79% | 5/3/2024 |
| OKE UN | ONEOK Inc | 2.73% | 4/30/2024 |
Utilities Select Sector Index
| Ticker | Name | Weight in the Index | Expected Earnings Release |
| NEE UN | NextEra Energy Inc | 13.74% | 4/25/2024 |
| SO UN | Southern Co/The | 7.88% | 5/2/2024 |
| DUK UN | Duke Energy Corp | 7.65% | 5/7/2024 |
| CEG UW | Constellation Energy Corp | 6.31% | 5/3/2024 |
| SRE UN | Sempra | 4.61% | 5/3/2024 |
| D UN | Dominion Energy Inc | 4.23% | 5/2/2024 |
| EXC UW | Exelon Corp | 3.86% | 5/2/2024 |
| PCG UN | PG&E Corp | 3.70% | 4/25/2024 |
| PEG UN | Public Service Enterprise Group Inc | 3.43% | 5/2/2024 |
| ED UN | Consolidated Edison Inc | 3.23% | 5/3/2024 |
S&P Transportation Select Industry FMC Capped Index
| Ticker | Name | Weight in the Index | Expected Earnings Release |
| UBER UN | Uber Technologies Inc | 17.79% | 5/2/2024 |
| UNP UN | Union Pacific Corp | 17.13% | 4/25/2024 |
| UPS UN | United Parcel Service Inc | 8.96% | 4/23/2024 |
| DAL UN | Delta Air Lines Inc | 5.10% | 4/10/2024 |
| FDX UN | FedEx Corp | 5.05% | 6/25/2024 |
| ODFL UW | Old Dominion Freight Line Inc | 4.72% | 4/24/2024 |
| NSC UN | Norfolk Southern Corp | 4.51% | 4/24/2024 |
| CSX UW | CSX Corp | 4.34% | 4/17/2024 |
| EXPD UN | Expeditors International of Washington Inc | 2.92% | 5/7/2024 |
| LUV UN | Southwest Airlines Co | 2.91% | 4/25/2024 |
S&P Retail Select Industry Index
| Ticker | Name | Weight in the Index | Expected Earnings Release |
| GES UN | Guess? Inc | 1.69% | 5/24/2024 |
| GPS UN | Gap Inc/The | 1.64% | 5/24/2024 |
| DKS UN | Dick's Sporting Goods Inc | 1.63% | 5/23/2024 |
| BOOT UN | Boot Barn Holdings Inc | 1.60% | 5/17/2024 |
| JWN UN | Nordstrom Inc | 1.59% | 5/31/2024 |
| AEO UN | American Eagle Outfitters Inc | 1.56% | 5/24/2024 |
| SIG UN | Signet Jewelers Ltd | 1.53% | 6/7/2024 |
| AN UN | AutoNation Inc | 1.53% | 4/19/2024 |
| GPI UN | Group 1 Automotive Inc | 1.52% | 4/26/2024 |
| VSCO UN | Victoria's Secret & Co | 1.52% | 5/31/2024 |
S&P Oil & Gas Exploration & Production Select Industry Index
| Ticker | Name | Weight in the Index | Expected Earnings Release |
| VLO UN | Valero Energy Corp | 2.85% | 4/25/2024 |
| PBF UN | PBF Energy Inc | 2.85% | 5/2/2024 |
| MPC UN | Marathon Petroleum Corp | 2.83% | 4/30/2024 |
| MRO UN | Marathon Oil Corp | 2.80% | 5/1/2024 |
| MUR UN | Murphy Oil Corp | 2.76% | 5/2/2024 |
| COP UN | ConocoPhillips | 2.76% | 5/2/2024 |
| DVN UN | Devon Energy Corp | 2.71% | 5/1/2024 |
| EOG UN | EOG Resources Inc | 2.68% | 5/2/2024 |
| CHRD UW | Chord Energy Corp | 2.67% | 5/3/2024 |
| PSX UN | Phillips 66 | 2.65% | 4/26/2024 |
S&P Regional Banks Select Industry Index
| Ticker | Name | Weight in the Index | Expected Earnings Release |
| RF UN | Regions Financial Corp | 2.56% | 4/19/2024 |
| TFC UN | Truist Financial Corp | 2.55% | 4/22/2024 |
| HBAN UW | Huntington Bancshares Inc/OH | 2.54% | 4/19/2024 |
| OZK UW | Bank OZK | 2.50% | 4/17/2024 |
| ZION UW | Zions Bancorp NA | 2.49% | 4/22/2024 |
| CFG UN | Citizens Financial Group Inc | 2.49% | 4/17/2024 |
| WAL UN | Western Alliance Bancorp | 2.48% | 4/18/2024 |
| FHN UN | First Horizon Corp | 2.47% | 4/17/2024 |
| WBS UN | Webster Financial Corp | 2.46% | 4/23/2024 |
| EWBC UW | East West Bancorp Inc | 2.45% | 4/23/2024 |
Dow Jones U.S. Select Aerospace & Defense Index
| Ticker | Name | Weight in the Index | Expected Earnings Release |
| RTX UN | RTX Corp | 18.35% | 4/23/2024 |
| BA UN | Boeing Co/The | 14.27% | 4/24/2024 |
| LMT UN | Lockheed Martin Corp | 12.86% | 4/23/2024 |
| GD UN | General Dynamics Corp | 4.76% | 4/24/2024 |
| TXT UN | Textron Inc | 4.68% | 4/25/2024 |
| TDG UN | TransDigm Group Inc | 4.65% | 5/9/2024 |
| AXON UW | Axon Enterprise Inc | 4.38% | 5/9/2024 |
| NOC UN | Northrop Grumman Corp | 4.38% | 4/25/2024 |
| HWM UN | Howmet Aerospace Inc | 4.32% | 5/2/2024 |
| LHX UN | L3Harris Technologies Inc | 4.28% | 4/25/2024 |
NYSE FANG+ Index
| Ticker | Name | Weight in the Index | Expected Earnings Release |
| GOOGL UW | Alphabet Inc | 10.78% | 4/25/2024 |
| META UW | Meta Platforms Inc | 10.33% | 4/24/2024 |
| NFLX UW | Netflix Inc | 10.11% | 4/18/2024 |
| MSFT UW | Microsoft Corp | 9.99% | 4/25/2024 |
| TSLA UW | Tesla Inc | 9.89% | 4/23/2024 |
| NVDA UW | NVIDIA Corp | 9.40% | 5/22/2024 |
| SNOW UN | Snowflake Inc | 9.26% | 5/24/2024 |
Index Descriptions
- S&P 500® Index (SPXT) - Standard & Poor’s® selects the stocks comprising the S&P 500® Index (SPXT) on the basis of market capitalization, financial viability of the company and the public float, liquidity and price of a company’s shares outstanding. The Index is a float-adjusted, market capitalization-weighted index.
- S&P 500® High Beta Index (SP5HBIT) - Provided by S&P Dow Jones Indices (the "Index Provider"), which selects 100 securities to include in the Index from the S&P 500® Index that have the highest sensitivity to market movements, or “beta” over the past 12 months as determined by the Index Provider. Securities with the highest beta are generally the most volatile securities of the S&P 500® Index.
- Financial Select Sector Index (IXMTR) - Provided by S&P Dow Jones Indices and includes securities of companies from the following industries: Banks; Thrifts & Mortgage Finance; Diversified Financial Services; Consumer Finance; Capital Markets; Insurance; and Mortgage Real Estate Investment Trusts (REITs).
- Health Care Select Sector Index (IXVTR) - Provided by Standard & Poor’s and includes domestic companies from the healthcare sector, which includes the following industries: pharmaceuticals; health care equipment and supplies; health care providers and services; biotechnology; life sciences tools and services; and health care technology.
- Industrials Select Sector Index (IXITR) - Provided by S&P Dow Jones Indices and includes domestic companies from the industrials sector which includes the following industries: aerospace and defense; industrial conglomerates; marine; transportation infrastructure; machinery; road and rail; air freight and logistics; commercial services and supplies; professional services; electrical equipment; construction and engineering; trading companies and distributors; airlines; and building products.
- Real Estate Select Sector Index (IXRETR) - Provided by S&P Dow Jones Indices (the “Index Provider”) and includes securities of companies from the following industries: real estate management and development and real estate investment trusts (“REITs”), excluding mortgage REITs.
- Dow Jones Internet Composite Index (DJINETT) - Provided by S&P Dow Jones Indices and includes companies that generate at least 50% of their annual sales/revenue from the internet as determined by the Index Provider. Additionally, each stock must have a minimum of three months’ trading history and a three month average market capitalization of at least $100 million. The Index consists of 40 stocks from two different sectors, internet commerce and internet services
- S&P Biotechnology Select Industry Index (SPSIBITR) - Provided by S&P Dow Jones Indices LLC and includes domestic companies from the biotechnology industry. The Index is a modified equal – weighted index that is designed to measure the performance of the biotechnology sub-industry based on the Global Industry Classification Standards (GICS).
- NYSE Semiconductor Index (ICESEMIT) - A rules-based, modified float-adjusted market capitalization-weighted index that tracks the performance of the thirty largest U.S. listed semiconductor companies.
- Dow Jones U.S. Select Home Construction Index (DJSHMBT) - Measures U.S companies in the home construction sector that provide a wide range of products and services related to homebuilding, including home construction and producers, sellers and suppliers of building materials, furnishings and fixtures and also home improvement retailers. The Index may include large-, mid- or small-capitalization companies.
- NASDAQ 100® Equal Weighted Index (NETR) - Includes 100 of the largest non-financial securities listed on NASDAQ®, but instead of being weighted by market capitalization, each of the constituents is initially set at 1.00%.
- S&P Mid Cap 400® Index (SPTRMDCP) - Measures the performance of 400 mid-sized companies in the United States. The Index is a free-float adjusted market capitalization-weighted index composed of liquid common stocks.
- Russell 2000® Index (RU20INTR) - Measures the performance of approximately 2,000 small-capitalization companies in the Russell 3000® Index, based on a combination of their market capitalization.
- Technology Select Sector Index (IXTTR) - Provided by S&P Dow Jones Indices and includes domestic companies from the technology sector which includes the following industries: computers and peripherals; software; diversified telecommunications services; communications equipment; semiconductors and semi-conductor equipment; internet software and services; IT services; electronic equipment, instruments and components; wireless telecommunication services; and office electronics.
- Energy Select Sector Index (IXETR) - Provided by S&P Dow Jones Indices and includes domestic companies from the energy sector which includes the following industries: oil, gas and consumable fuels; and energy equipment and services.
- Utilities Select Sector Index (IXUTR) - Provided by S&P Dow Jones Indices and includes domestic companies from the utilities sector which includes the following industries: electric utilities; multi-utilities; water utilities; independent power producers and energy trades; and gas utilities.
- S&P Transportation Select Industry FMC Capped Index (SPTSCUT) - Provided by S&P Dow Jones Indices and is designed to measure stocks in the S&P Total Market Index that are included in the GICS transportation sub-industry.
- S&P Retail Select Industry Index (SPSIRETR) - A modified equal-weighted index that is designed to measure performance of the stocks comprising the S&P Total Market Index that are classified in the Global Industry Classification Standard (GICS) retail sub-industry.
- S&P Oil & Gas Exploration & Production Select Industry Index (SPSIOPTR) - Provided by Standard & Poor’s Index Provider and includes domestic companies from the oil and gas exploration and production sub industry. The Index is a modified equal weighted index that is designed to measure the performance of a sub industry or group of sub industries determined based on the Global Industry Classification Standards (GICS).
- S&P Regional Banks Select Industry Index (SPSIRBKT) - A modified equal-weighted index that is designed to measure performance of the stocks comprising the S&P Total Market Index that are classified in the Global Industry Classification Standard (GICS) regional banks sub-industry.
- Dow Jones U.S. Select Aerospace & Defense Index (DJSASDT) - Provided by Dow Jones U.S. Index (the “Index Provider”). The Index attempts to measure the performance of the aerospace and defense industry of the U.S. equity market. The Index Provider selects the stocks comprising the Index from the aerospace and defense sector on the basis of the float-adjusted, market capitalization-weight of each constituent. Aerospace companies include manufacturers, assemblers and distributors of aircraft and aircraft parts. Defense companies include producers of components and equipment for the defense industry, such as military aircraft, radar equipment and weapons.
- NYSE FANG+ Index (NYFANGT) - An equal-dollar weighted Index designed to track the performance of 10 highly-traded growth stocks of technology and tech-enabled companies. The Index is comprised of the securities of U.S.-listed companies that ICE Data Indices, LLC (the “Index Provider”) has identified as FANG+ companies, which are comprised of the six FAANMG companies and four non-FAANMG companies. The Index Provider defines the FAANMG as Meta Platforms Inc. (META), Apple Inc. (AAPL), Amazon.com Inc. (AMZN), Netflix Inc. (NFLX), Microsoft Corp. (MSFT), and Alphabet Inc. Class A (GOOGL). The Index is reconstituted quarterly.